etcdの監視
システムの健全性確認とクラスターのデバッグのためのetcd監視
各etcdサーバーは、クライアントポートのHTTPエンドポイントを通じて、ローカルの監視情報を提供します。監視データは、システムの健全性確認とクラスターのデバッグの両方に役立ちます。
デバッグエンドポイント
--log-level=debugを設定すると、etcdサーバーはクライアントポートの/debugパスでデバッグ情報を公開します。性能が低下し、ログ出力が多くなるため、--log-level=debugの設定には注意してください。
/debug/pprofは、Goランタイムの標準的なプロファイリング用エンドポイントです。CPU、ヒープ、ミューテックス、goroutineの使用状況を調査できます。たとえば次のgo tool pprofは、etcdが時間を費やしている関数の上位10件を取得します。
$ go tool pprof http://localhost:2379/debug/pprof/profile
Fetching profile from http://localhost:2379/debug/pprof/profile
Please wait... ( 30s)
Saved profile in /home/etcd/pprof/pprof.etcd.localhost:2379.samples.cpu.001.pb.gz
Entering interactive mode ( type "help" for commands)
( pprof) top10
310ms of 480ms total ( 64.58%)
Showing top 10 nodes out of 157 ( cum >= 10ms)
flat flat% sum% cum cum%
130ms 27.08% 27.08% 130ms 27.08% runtime.futex
70ms 14.58% 41.67% 70ms 14.58% syscall.Syscall
20ms 4.17% 45.83% 20ms 4.17% github.com/coreos/etcd/vendor/golang.org/x/net/http2/hpack.huffmanDecode
20ms 4.17% 50.00% 30ms 6.25% runtime.pcvalue
20ms 4.17% 54.17% 50ms 10.42% runtime.schedule
10ms 2.08% 56.25% 10ms 2.08% github.com/coreos/etcd/vendor/github.com/coreos/etcd/etcdserver.( *EtcdServer) .AuthInfoFromCtx
10ms 2.08% 58.33% 10ms 2.08% github.com/coreos/etcd/vendor/github.com/coreos/etcd/etcdserver.( *EtcdServer) .Lead
10ms 2.08% 60.42% 10ms 2.08% github.com/coreos/etcd/vendor/github.com/coreos/etcd/pkg/wait.( *timeList) .Trigger
10ms 2.08% 62.50% 10ms 2.08% github.com/coreos/etcd/vendor/github.com/prometheus/client_golang/prometheus.( *MetricVec) .hashLabelValues
10ms 2.08% 64.58% 10ms 2.08% github.com/coreos/etcd/vendor/golang.org/x/net/http2.( *Framer) .WriteHeaders /debug/requestsエンドポイントでは、WebブラウザーでgRPCトレースと性能統計を確認できます。次は、キーabcに対するRangeリクエストの例です。
When	Elapsed (s)
2017/08/18 17:34:51.999317 	0.000244 	/etcdserverpb.KV/Range
17:34:51.999382 	 .    65 	... RPC: from 127.0.0.1:47204 deadline:4.999377747s
17:34:51.999395 	 .    13 	... recv: key:"abc"
17:34:51.999499 	 .   104 	... OK
17:34:51.999535 	 .    36 	... sent: header:<cluster_id:14841639068965178418 member_id:10276657743932975437 revision:15 raft_term:17 > kvs:<key:"abc" create_revision:6 mod_revision:14 version:9 value:"asda" > count:1
メトリクスエンドポイント
各etcdサーバーは、クライアントポートの/metricsパスでメトリクスを公開します。必要に応じて、--listen-metrics-urlsで指定した場所にも公開します。
メトリクスはcurlで取得できます。
$ curl -L http://localhost:2379/metrics | grep -v debugging # ignore unstable debugging metrics
# HELP etcd_disk_backend_commit_duration_seconds The latency distributions of commit called by backend.
# TYPE etcd_disk_backend_commit_duration_seconds histogram
etcd_disk_backend_commit_duration_seconds_bucket{ le = "0.002" } 72756
etcd_disk_backend_commit_duration_seconds_bucket{ le = "0.004" } 401587
etcd_disk_backend_commit_duration_seconds_bucket{ le = "0.008" } 405979
etcd_disk_backend_commit_duration_seconds_bucket{ le = "0.016" } 406464
... ヘルスチェック
v3.3.0以降、--listen-metrics-urlsで指定した場所は、/metricsに加えて/healthエンドポイントにも応答します。これは、標準のエンドポイントに相互(クライアント)TLS認証を設定していても、ロードバランサーや監視サービスがヘルスチェックにアクセスする必要がある場合に役立ちます。
v3.4以降、/livezと/readyzの2つのエンドポイントが追加されています。
/livezは、プロセスが生存しているか、再起動が必要かを示します。/readyzは、プロセスがトラフィックを処理できる状態かを示します。
エンドポイントの設計の詳細は、KEP
に記載されています。
各エンドポイントには複数の個別のヘルスチェックが含まれます。verboseパラメーターを使うと、チェックの詳細と状態を出力できます。例:
curl -k http://localhost:2379/readyz?verbose 次のようなレスポンスが返ります。
[+]data_corruption ok
[+]serializable_read ok
[+]linearizable_read ok
ok
HTTP APIでは、特定のチェックを除外することもできます。例:
curl -k http://localhost:2379/readyz?exclude= data_corruption Prometheus
etcdのメトリクスを取り込んで記録する最も簡単な方法は、Prometheus
の監視サービスを実行することです。
まず、Prometheusをインストールします。
PROMETHEUS_VERSION = "2.0.0"
wget https://github.com/prometheus/prometheus/releases/download/v$PROMETHEUS_VERSION /prometheus-$PROMETHEUS_VERSION .linux-amd64.tar.gz -O /tmp/prometheus-$PROMETHEUS_VERSION .linux-amd64.tar.gz
tar -xvzf /tmp/prometheus-$PROMETHEUS_VERSION .linux-amd64.tar.gz --directory /tmp/ --strip-components= 1
/tmp/prometheus -version Prometheusのスクレイパーの対象に、etcdクラスターのエンドポイントを設定します。
cat > /tmp/test-etcd.yaml <<EOF
global:
  scrape_interval: 10s
scrape_configs:
  - job_name: test-etcd
    static_configs:
    - targets: ['10.240.0.32:2379','10.240.0.33:2379','10.240.0.34:2379']
EOF
cat /tmp/test-etcd.yaml
Prometheusのハンドラーを設定します。
nohup /tmp/prometheus \
-config.file /tmp/test-etcd.yaml \
-web.listen-address ":9090" \
-storage.local.path "test-etcd.data" >> /tmp/test-etcd.log 2>& 1 & これで、Prometheusは10秒ごとにetcdのメトリクスを収集します。
アラート
etcd v3クラスター向けに、Prometheusのデフォルトアラート
が用意されています。
注記
用途に応じてjobラベルの調整が必要になる場合があります。これらのルールは単一のクラスターに適用するよう作られているため、クラスター固有のラベルを選ぶことを推奨します。
Grafana
Grafana
にはPrometheus対応が組み込まれているため、Prometheusデータソースを追加するだけで使えます。
Name:   test-etcd
Type:   Prometheus
Url:    http://localhost:9090
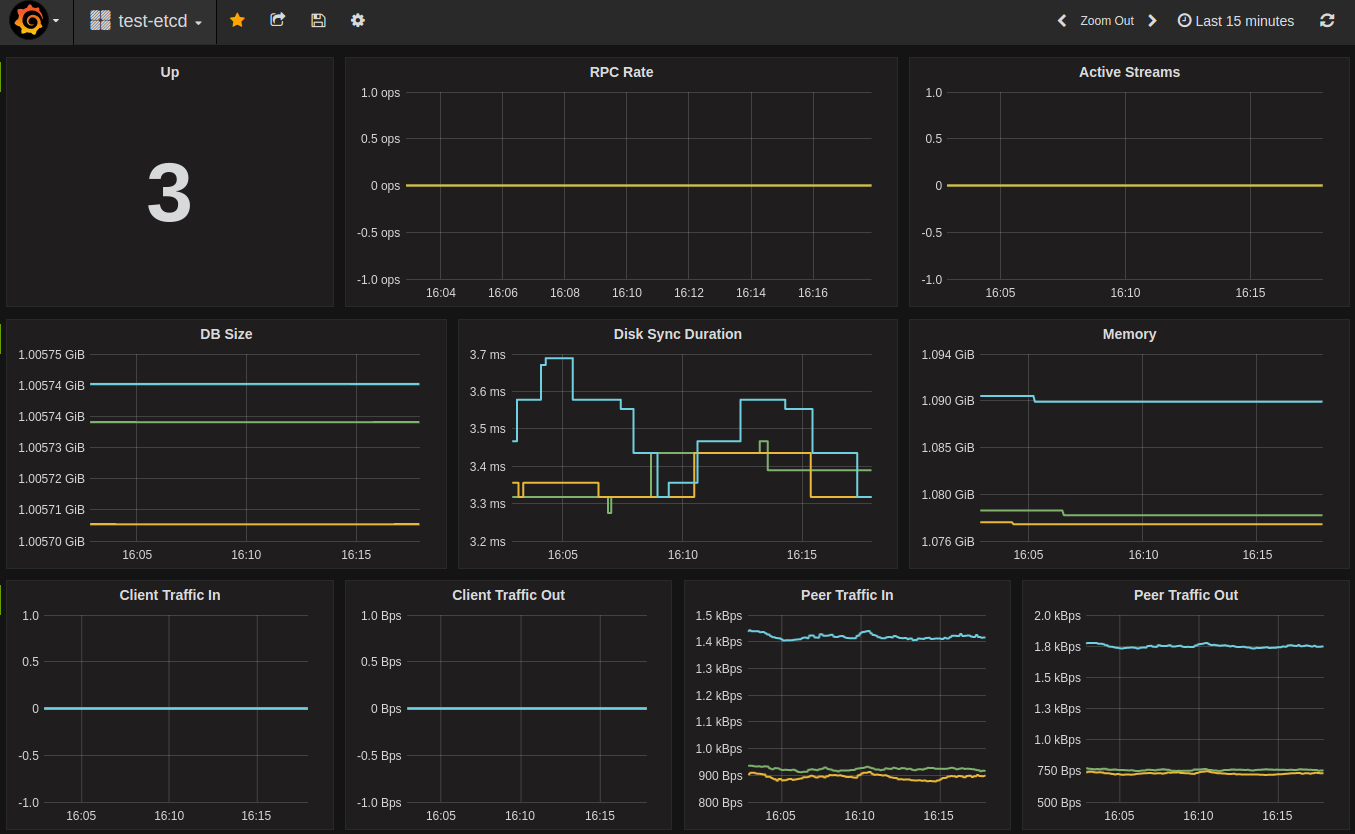
Access: proxy次に、デフォルトのetcdダッシュボードテンプレート
をインポートし、カスタマイズします。たとえば、Prometheusデータソース名がmy-etcdであれば、JSONのdatasourceフィールドの値もmy-etcdにする必要があります。
ダッシュボードの例:
分散トレーシング
etcdはv3.5で、OpenTelemetry
を使った分散トレーシングに対応しました。
注記
etcd 3.7では、以下のトレーシング用フラグから以前のexperimental接頭辞を除いたものを使用してください。
分散トレーシングを有効にするには、etcdサーバーに--enable-distributed-tracing=trueを指定します。また、--distributed-tracing-sampling-rate=<number>フラグで、100万スパンあたりに収集するサンプル数を指定します。デフォルトのサンプリングレートは0です。
分散トレーシングを構成するには、次の任意のフラグを指定してetcdサーバーを起動します。
--distributed-tracing-address - (任意)- “localhost:4317” - トレースコレクターのアドレス。
--distributed-tracing-service-name - (任意)- “etcd” - 分散トレーシングのサービス名。すべてのetcdインスタンスで同じにしなければなりません。
--distributed-tracing-instance-id - (任意)- インスタンスID。任意ですが、設定を強く推奨します。etcdインスタンスごとに一意でなければなりません。
分散トレーシングを有効にする前に、OpenTelemetryのエンドポイントを用意してください。アドレスがデフォルトと異なる場合は、--distributed-tracing-addressフラグで上書きします。OpenTelemetryにはさまざまな実行方法があるため、詳しくはコレクターのドキュメント
を参照してください。
注記
ほかの可観測性シグナルと同様に、リソースのオーバーヘッドがあります。初期の測定では、CPUのオーバーヘッドは2%〜4%になる可能性があります。